History
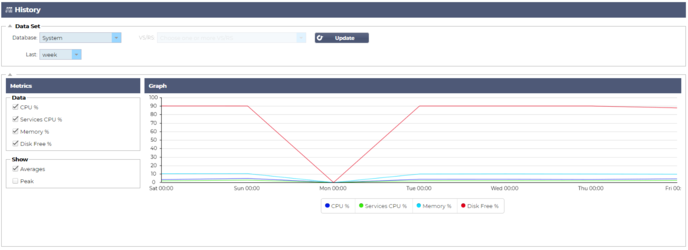
The History option, selectable from the navigator, allows the administrator to examine the historical performance of the ADC. Historical views can be generated for Virtual Services, Real Servers, and System.
It also allows you to see load balancing in action and helps catch any errors or patterns that need investigating. Note that you must enable historical logging in System > History to make use of this feature.
Viewing Graphical Data
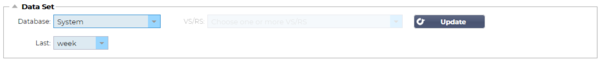
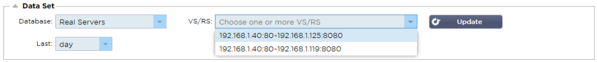
Data Set
To view the historical data in graphical format, please proceed as follows:
The first step is to choose the database and period relevant to the information you wish to view. The period that you can select from the Last drop-down is Minute, Hour, Day, Week, Month, and Year.
|
Database
|
Description
|
|
System
|
Selecting this database will allow you to see CPU, memory, and disk drive space over time
 |
|
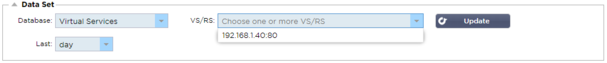
Virtual Services
|
Selecting this database will allow you to choose all of the virtual services in the database from when you started logging data. You will see a list of Virtual Services from which you can select one.
 |
|
Real Services
|
Selecting this database will allow you to choose all the Real Servers in the database from when you started logging the data. You will see a list of Real Servers from which you can select one.
 |
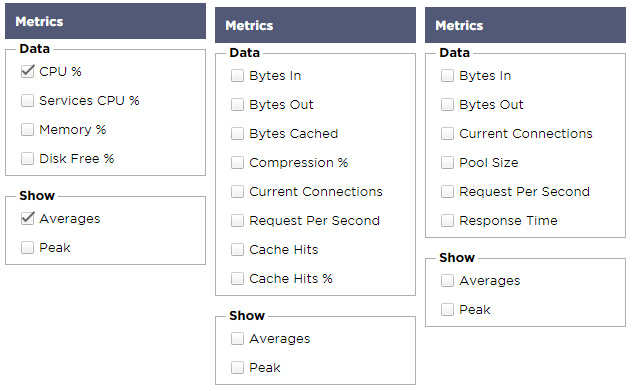
Metrics
Once you have selected the Data Set that you will use, it is time to choose the Metrics you wish to display. The image below illustrates the metrics available for selection by the administrator: these selections correspond with System, Virtual services, and Real Servers (left to right).
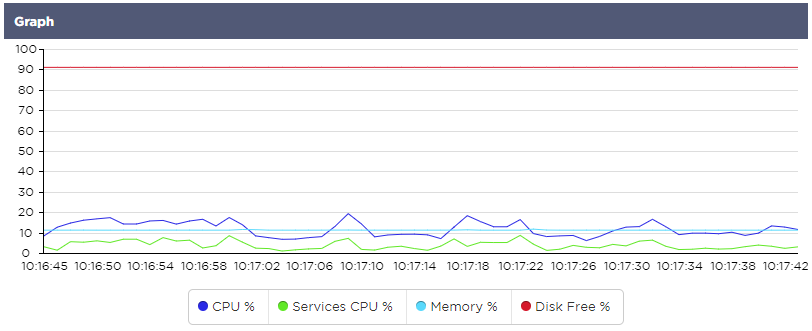
Sample Graph