
Statistics
The Statistics section of the ADC is a much-used area by system administrators who want to ensure that the ADC performance is on par with their expectations.
Compression
The whole purpose of the ADC is to monitor data and direct it to Real Servers configured to receive it. The compression feature is provided in the ADC to increase the ADC’s performance. There will be times when administrators will wish to test and check the ADC’s data compression information; this data provided by the Compression panel within Statistics.
Content Compression to Date

The data shown in this section details the level of compression achieved by the ADC on compressible content. A value of 60-80% is what we would term as typical
Overall Compression to Date
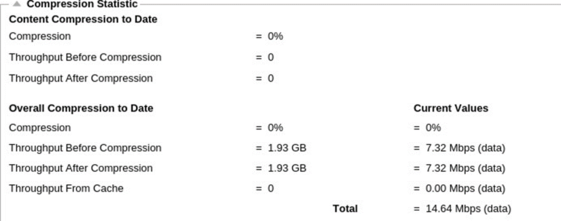
The values provided in this section report how much compression the ADC has achieved on all content. A typical percentage for this depends on how many pre-compressed images are contained in your services. The more the number of images, the smaller the overall compression percentage is likely to be.
Total Input/Output
The Total Input/Output figures represent the amount of raw data traversed into and out of the ADC. The unit of measurement will change as the size grows from kbps to Mbps to Gbps.
Hits and Connections
The Hits and Connections section contains the overall statistics for hits and transactions that pass through the ADC. So what do hits and connections mean?
· A Hit is defined as a Layer 7 transaction. Typically used for web servers, this is a GET request for an object such as an image.
· A Connection is defined as a Layer 4 TCP connection. Many transactions can occur over 1 TCP connection.
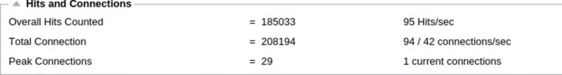
Overall Hits Counted
The figures within this section show the cumulative number of non-cached hits since the last reset. On the right-hand side, the figure will show the current number of hits per second.
Total Connections
The Total Connections value represents the cumulative number of TCP connections since the last reset. The figure in the second column indicates the TCP connections made per second to the ADC. The number in the right-side column is the number of TCP connections per second made to the Real Servers. Example 6/8 connections/sec. We have 6 TCP connections per second to the Virtual Service and 6 TCP connections per second to the Real Servers in the example shown.
Peak Connections
The peak Connections value represents the maximum number of TCP connections made to the ADC. The number on the rightmost column indicates the current number of active TCP connections.
Caching
As you will recall, the ADC is equipped with both compression and caching. This section shows the overall statistics related to caching when applied to a channel. If caching has not been applied to a channel and configured correctly, you will see 0 cache contents.

From Cache
Hits: The first column gives the total number of transactions served from the ADC cache since the last reset. A percentage of the total transactions is also provided.
Bytes: The second column gives the total amount of data in Kilobytes served from the ADC cache. A percentage of total data is also provided.
From Server
Hits: Column 1 gives the total number of transactions served from the Real Servers since the last reset. A percentage of total transactions is also provided.
Bytes: The second column gives the total amount of data in Kilobytes served from the Real Servers. A percentage of total data is also provided.
Cache Contents
Hits: This number gives the total number of objects contained in the ADC cache.
Bytes: The first number gives the overall size in Megabytes of the ADC cached objects. A percentage of the maximum cache size is also provided.
Session Persistence
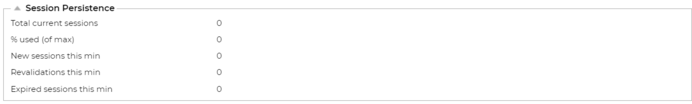
The Session Persistence section delivers information for several parameters.
|
Field
|
Description
|
|
Total current sessions
|
This shows how many persistence sessions are in progress - updated each minute
|
|
% Used (of max)
|
This shows how much usage there is of the total space allowed for session information
|
|
New session this min
|
This shows, within the last minute, how many new persistence sessions were added
|
|
Revalidate this min
|
This shows, within the last minute, how many existing persistence sessions were revalidated by more traffic
|
|
Expired sessions this min
|
This shows, within the last minute, how many existing persistence sessions expired due to no further traffic within the timeout
|
Hardware
Whether you are using the ADC in a virtual environment or within hardware, this section will provide you with valuable information on the appliance's performance.
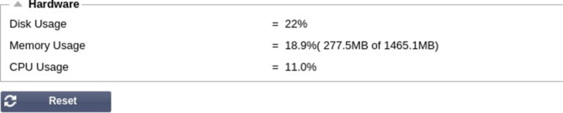
Disk Usage
The value provided in column 2 gives the percentage of disk space currently used and includes information on log files and cache data, which is periodically stored on the storage.
Memory Usage
The second column gives the percentage of memory currently used. The more significant number in brackets is the total amount of memory allocated to the ADC. It is recommended that the ADC be allocated a minimum of 2GB of RAM.
CPU Usage
One of the critical values provided is the percentage of CPU currently used by ADC. It is natural for this to fluctuate.