
The Real Server Monitor Page
The Real Server Monitors page is split into three sections.
· Details
· Upload
· Custom Monitors
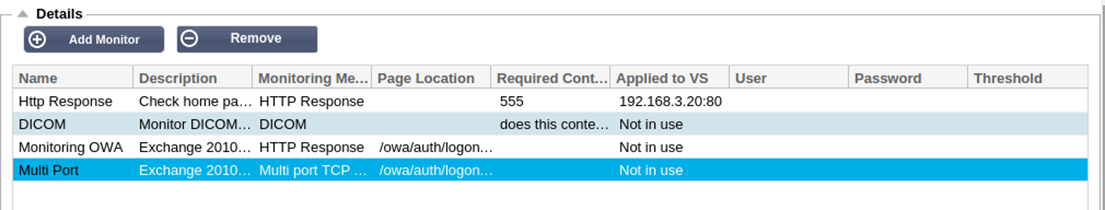
Details
The Details section is used to add new monitors and to remove any that you do not need. You can also edit an existing monitor by double-clicking on it.
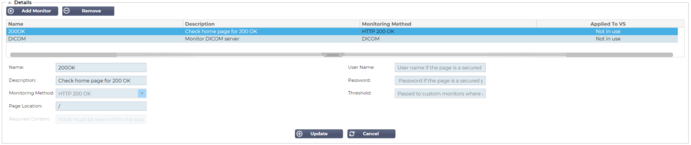
Name
Name of your choice for your monitor.
Description
Textual description for this Monitor, and we recommend that it is best to make it as descriptive as possible.
Monitoring Method
Choose the monitoring method from the drop-down list. Available choices are:
· HTTP 200 OK
· HTTP 200 Head
· HTTP 200 Options
· HTTP Head
· HTTP Options
· HTTP Response
· Multi-Port TCP Monitor
· TCP Out of Band
· DICOM
· SNMP v2
· DNS Server Check
· LDAPS
Page Location
URL Page location for an HTTP monitor. This value can be a relative link such as /folder1/folder2/page1.html. You can also use an absolute link where the website is bound to the hostname.
Required Content
This value contains any content that the monitor needs to detect and utilize. The value represented here will change depending on the monitoring method that is chosen.
Applied to VS
This field is automatically populated with the IP/Port of the Virtual Service to which the monitor is applied. You will not be able to delete any Monitor that has been used with a Virtual Service.
User
Some custom monitors can use this value along with the password field to log into a Real Server.
Password
Some custom monitors can use this value along with the User field to log into a Real Server.
Threshold
The Threshold field is a general integer used in custom monitors where a threshold such as the CPU level is required.
NOTE: Please ensure the response back from the Application server is not a "Chunked" response
Real Server Monitor examples
Upload Monitor
There will be many occasions when users wish to create their own custom monitors and this section allows them to upload them to the ADC.
Custom monitors are written using PERL scripts and have a .pl file extension.
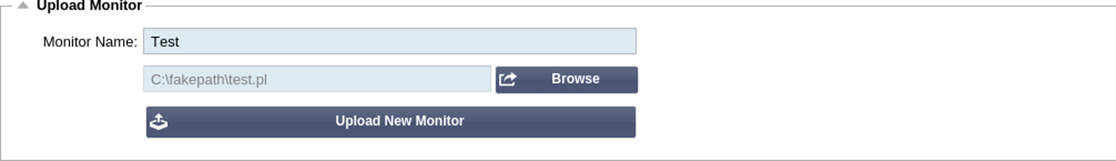
· Give your monitor a name so that you can identify it in the Monitoring Method list
· Browse for the .pl file
· Click Upload New Monitor
· Your file will be uploaded to the correct location and will be visible as a new Monitoring Method.
Custom Monitors
In this section, you can view custom monitors uploaded and remove them if they are no longer needed.
· Click the drop-down box
· Select the name of the custom monitor
· Click Remove
· Your custom monitor will no longer be visible in the Monitoring Method list
Creating a Custom Monitor Perl Script
CAUTION: This section is intended for persons with experience in using and writing in Perl
This section shows you the commands you can use within your Perl script.
The #Monitor-Name: command is the name used for the Perl Script stored on the ADC. If you do not include this line, then your script will not be found!
The following are mandatory:
· #Monitor-Name
· use strict;
· use warning;
The Perl scripts are run in a CHROOTED environment. They often call another application such as WGET or CURL. Sometimes these need to be updated for a specific features, such as SNI.
Dynamic Values
· my $host = $_[0]; - This uses the “Address” from IP Services--Real Server section
· my $port = $_[1]; - This uses the “Port” from IP Services--Real Server section
· my $content = $_[2]; - This uses the “Required Content” value from the Library--Real Server Monitoring section
· my $notes = $_[3]; - This uses the “Notes” column in Real Server section of IP Services
· my $page = $_[4]; - This uses the “Page Location” values from Library--Real Server Monitor section
· my $user = $_[5]; - This uses the “User” value from the Library--Real Server Monitor section
· my $password = $_[6]; - This uses the “Password” value from the Library--Real Server Monitor section
Custom Health Checks have two outcomes
· Successful
Return Value 1
Print a success message to Syslog
Mark the Real Server Online (provided IN COUNT match)
· Unsuccessful
Return Value 2
Print a message saying Unsuccessful to Syslog
Mark the Real Server Offline (provided OUT Count match)
Example of a Custom Health Monitor
#Monitor-Name HTTPS_SNI
use strict:
use warnings;
# The monitor name as above is displayed in the drop-down of Available health checks
# There are 6 value passed to this script (see below)
# The script will return the following values
# 1 is the test is successful
# 2 if the test is unsuccessful sub monitor
{
my Shost = $_[O]; ### Host IP or name
my Sport = $_[1]; ### Host Port
my Scontent = $_[2]; ### Content to look for (in the web page and HTTP headers)
my Snotes = $_[3]; ### Virtual host name
my Spage = $_[4]; ### The part of the URL after the host address
my Suser = $_[5]: ### domain/usemame (optional)
my Spassword = $_[6]; ### password (optional)
my $resolve;
my $auth =;
if ($port)
{
$resolve = "$notes:$port:$host":
}
else {
$resolve = "$notes:$host";
}
if ($user && $password) {
$auth = ”-u $user:$password :
}
my @lines = 'curl -s -i -retry 1 -max-time 1 -k -H "Host:$notes --resolve $resolve $auth HTTPs://${notes}${page} 2>&1'; if(join(””@lines)=~/$content/)
{
print "HTTPs://$notes}${page} looking for - $content - Health check successful.\n”;
return(1);
}
else
{
print "HTTPs://${notes}${page} looking for - $content - Health check failed.\n";
return(2)
}
}
monitor(@ARGV):
NOTE: Custom Monitoring – Use of global variables is not possible. Use local variables only – variables defined inside functions