
Widgets
The Library > Widgets page allows you to configure various lightweight visual components displayed in your custom dashboard.
Configured Widgets
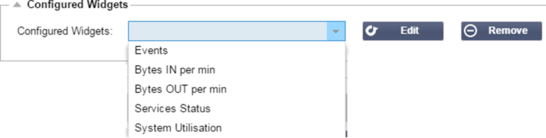
The Configured Widgets section allows you to view, edit or remove any widgets created from the available widgets section.
Available Widgets
There are five different widgets provided within the ADC, and you may configure them to your requirements.
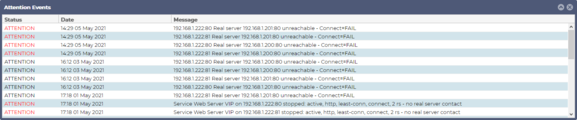
The Events Widget
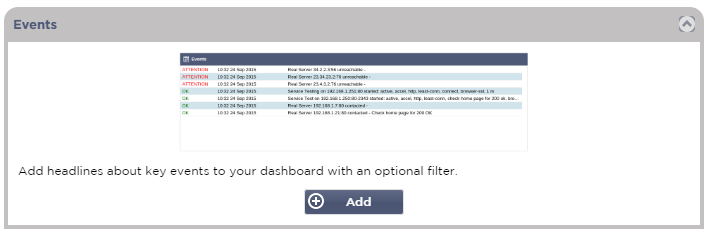
· To add an event to the Events widget, click the Add button.
· Provide a name for your event. In our example, we have added Attention Events as the event name.
· Add a keyword filter. We have also added the filter value of Attention
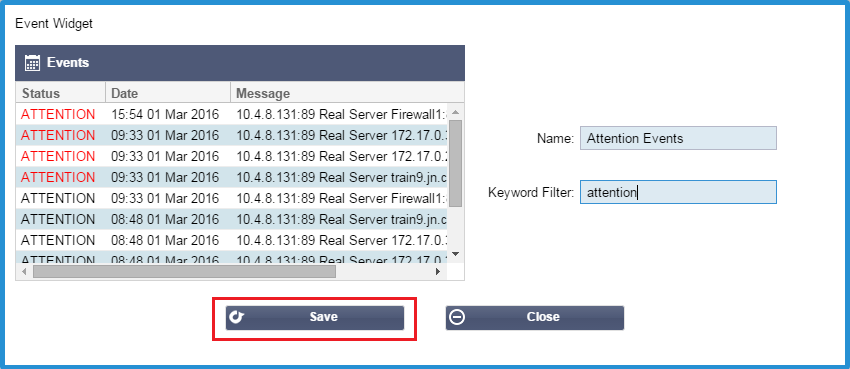
· Click Save, then Close
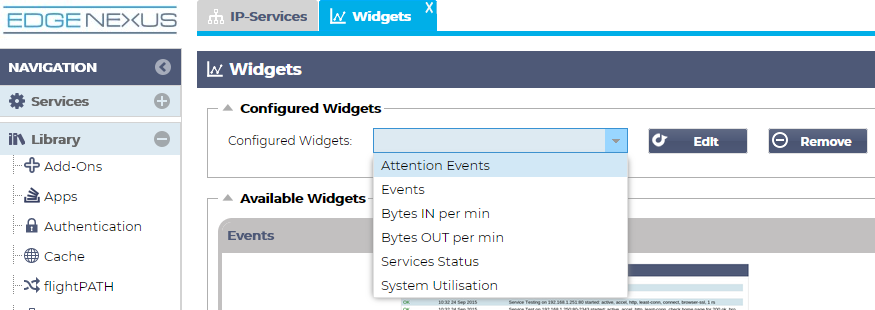
· You will now see an additional Widget called Attention Events in the Configured Widgets dropdown.
· You can see we have now added this widget in the View > Dashboard section.
· Select the Attention Events widget to display this within the Dashboard. See below.
You can also pause and restart the live data feed by clicking the Pause Live Data button. In addition, you can revert to the default dashboard at any time by clicking the Default Dashboard button.
The System Graphs Widget
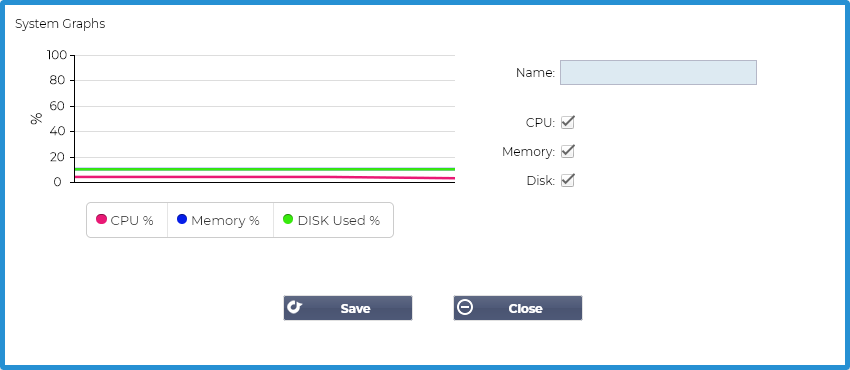
The ADC has a configurable System Graph widget. By clicking the Add button on the widget, you can add the following monitoring graphs to be displayed.
· CPU
· MEMORY
· DISK
Once you have added them, they will be individually available within the Dashboard’s widget menu.
Interface Widget
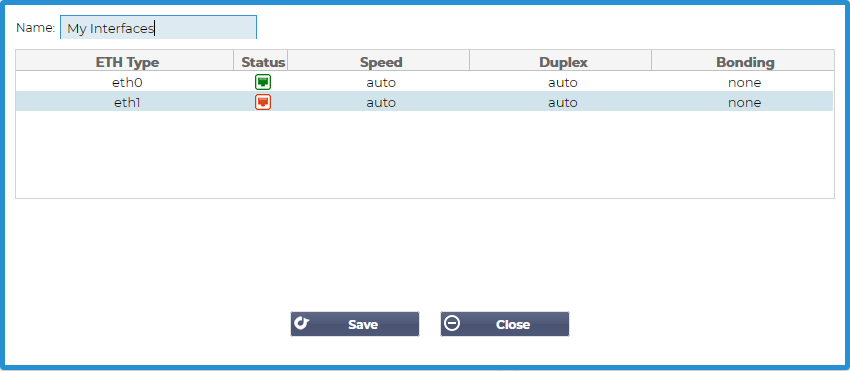
The Interface widget allows you to display the data for the chosen network interface, such as ETH0, ETH1, and so on. The number of available interfaces for addition depends on how many network interfaces you have defined for the virtual appliance or provisioned within the hardware appliance.
Once you have finished, click the Save button, then the Close button.
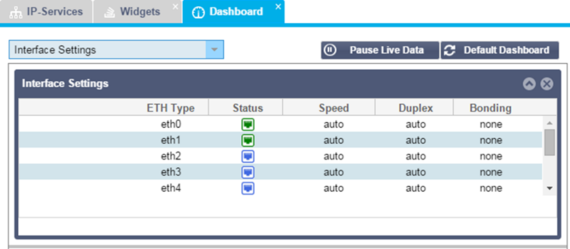
Select the Widget you just customized from the widget drop-down menu within the Dashboard. You will see a screen like the one below.
Status Widget
The Status widget allows you to see load balancing in action. You can also filter the view to show specific information.
· Click Add.
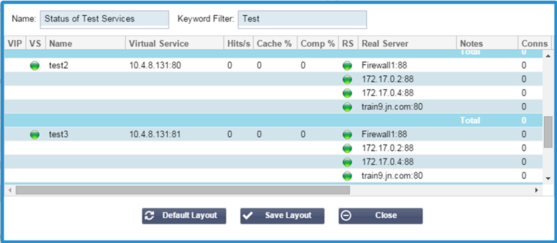
· Enter a name for the service you wish to monitor
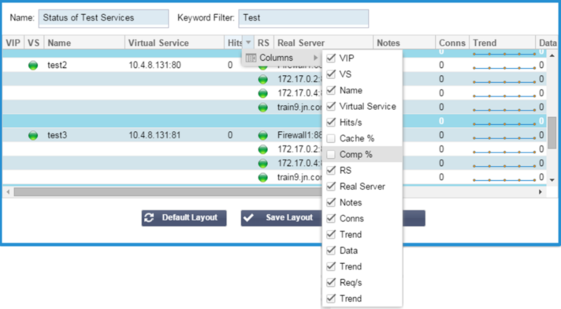
· You can also choose which columns you wish to display in the widget.
· Once you are satisfied, click Save, followed by Close.
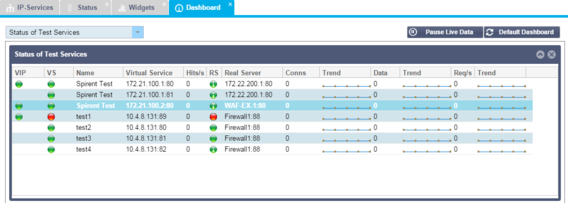
· The chosen Status widget will be available in the Dashboard section.
Traffic Graphics Widget
This widget can be configured to show current and historical traffic data per Virtual Services and Real Servers. In addition, you can see overall current and historic data for global traffic
· Click the Add button
· Name your widget.
· Choose a Database from Virtual Services, Real Servers, or System.
· If you choose Virtual Services, you can select a virtual service from the VS/RS drop-down.
· Choose a time frame from the Last drop-down.
o Minute – last 60s
o Hour – aggregated data from each minute for the last 60 minutes
o Day – aggregated data from each hour for the previous 24 hours
o Week – aggregated data from each day during the previous seven days
o Month – aggregated data from each week for the last seven days
o Year – aggregated data from each month during the previous 12 months
· Choose the Data available depending on the database you have chosen
o Virtual Services Database
o Bytes in
o Bytes out
o Bytes cached
o Compression %
o Current Connections
o Requests per second
o Cache Hits
o Cache Hits %
· Real Servers
o Bytes in
o Bytes out
o Current Connections
o Request per second
o Response time
· System
o CPU %
o Services CPU
o Memory %
o Disk Free %
o Bytes in
o Bytes out
· Chose to show either Average or Peak values
· Once you have chosen all the options, click Save and Close
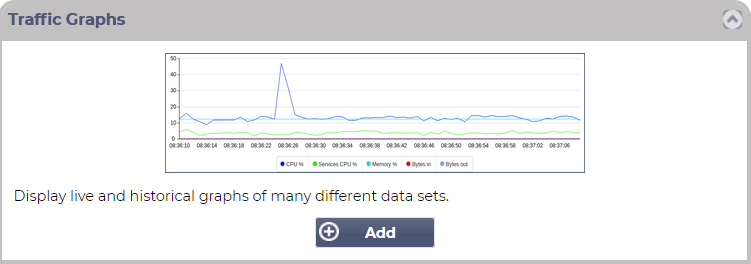
Example Traffic Graph
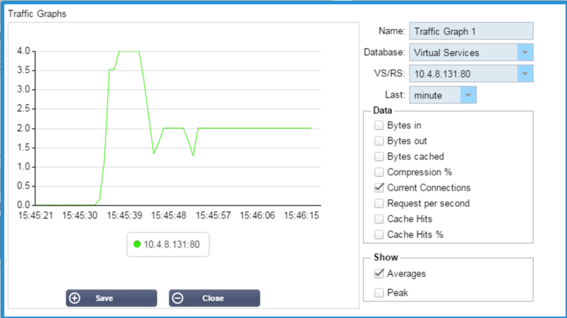
You can now add your Traffic Graph widget to the View > Dashboard.